Monitoring & Forecast
This section explains the user-facing monitoring and forecasting workspace.
Use it when you need to:
- inspect stored or current traffic samples
- compare traffic behavior over time
- generate forecasts from historical information
- remove samples that are no longer needed
Main Tabs
Intelligent IP Traffic Viewer
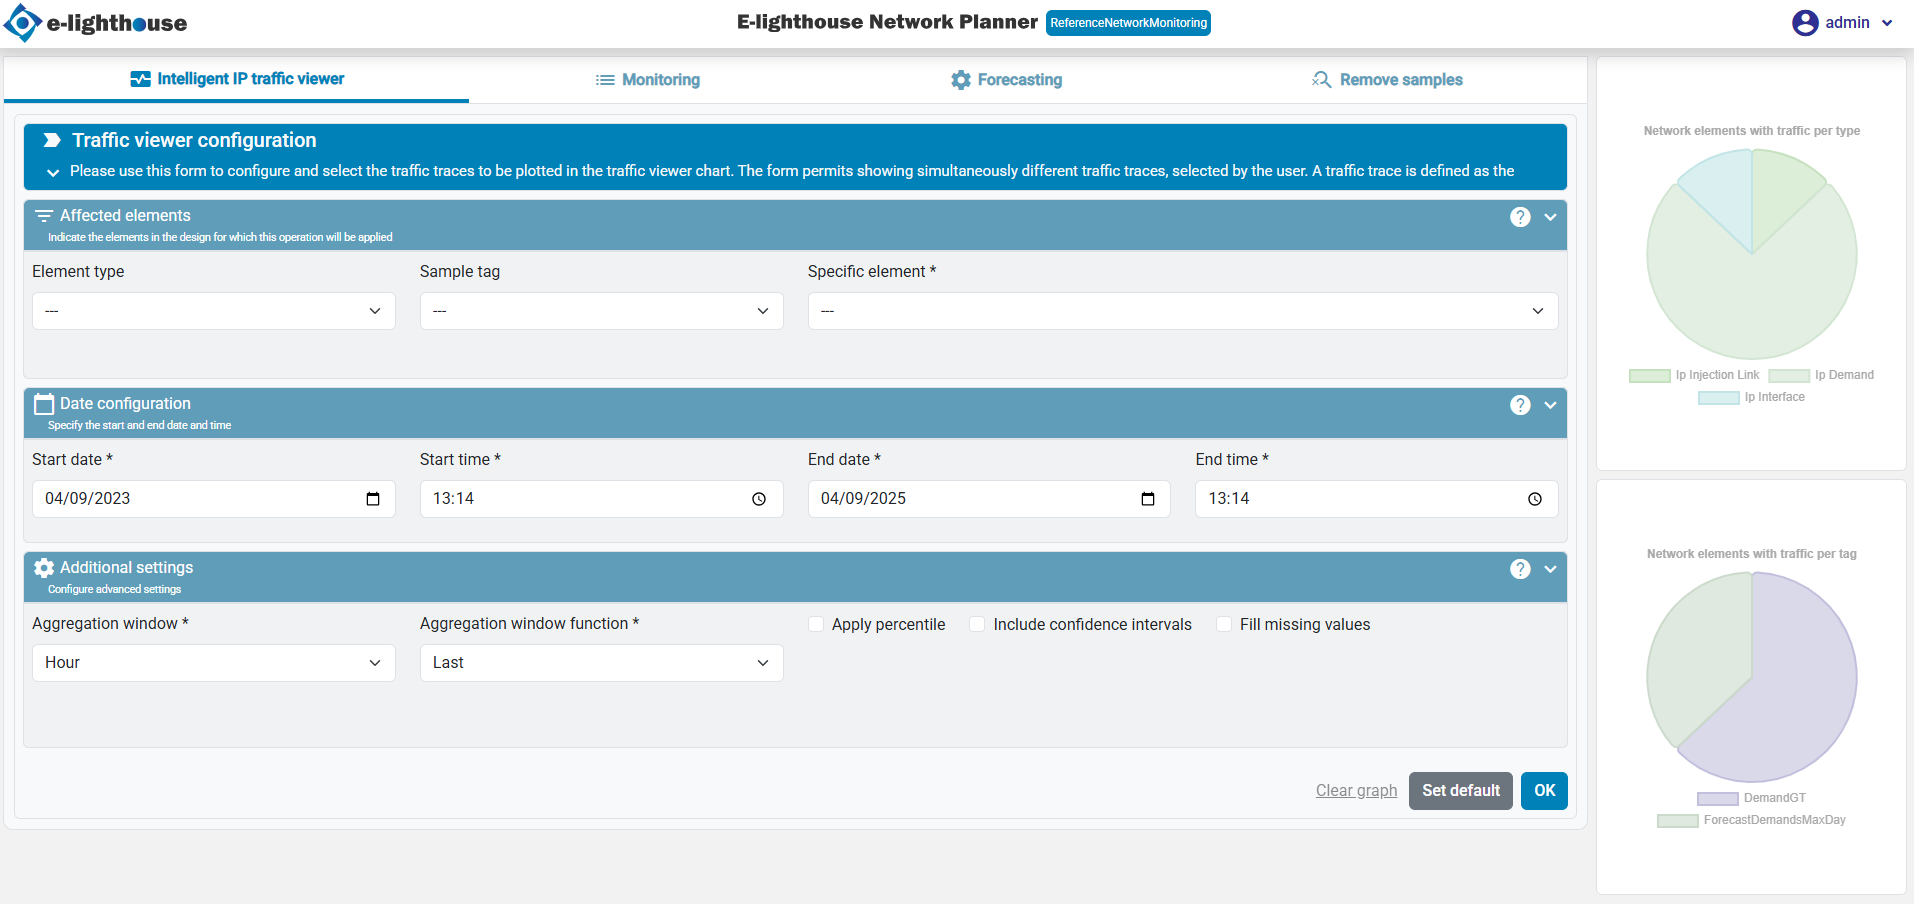
This tab is used to configure and visualize traffic traces.
Key Features
- A configuration form to select and filter traffic traces.
- A main graph displaying selected traffic data.
- A list of active traffic elements to keep track of monitored items.
Traffic viewer configuration
This feature provides a detailed view of IP traffic over time for the selected elements. Users can configure the time range, element types, and traffic tags to tailor the displayed data to their needs. If no data is available, an alert will guide users to set up the required configurations.
Monitoring
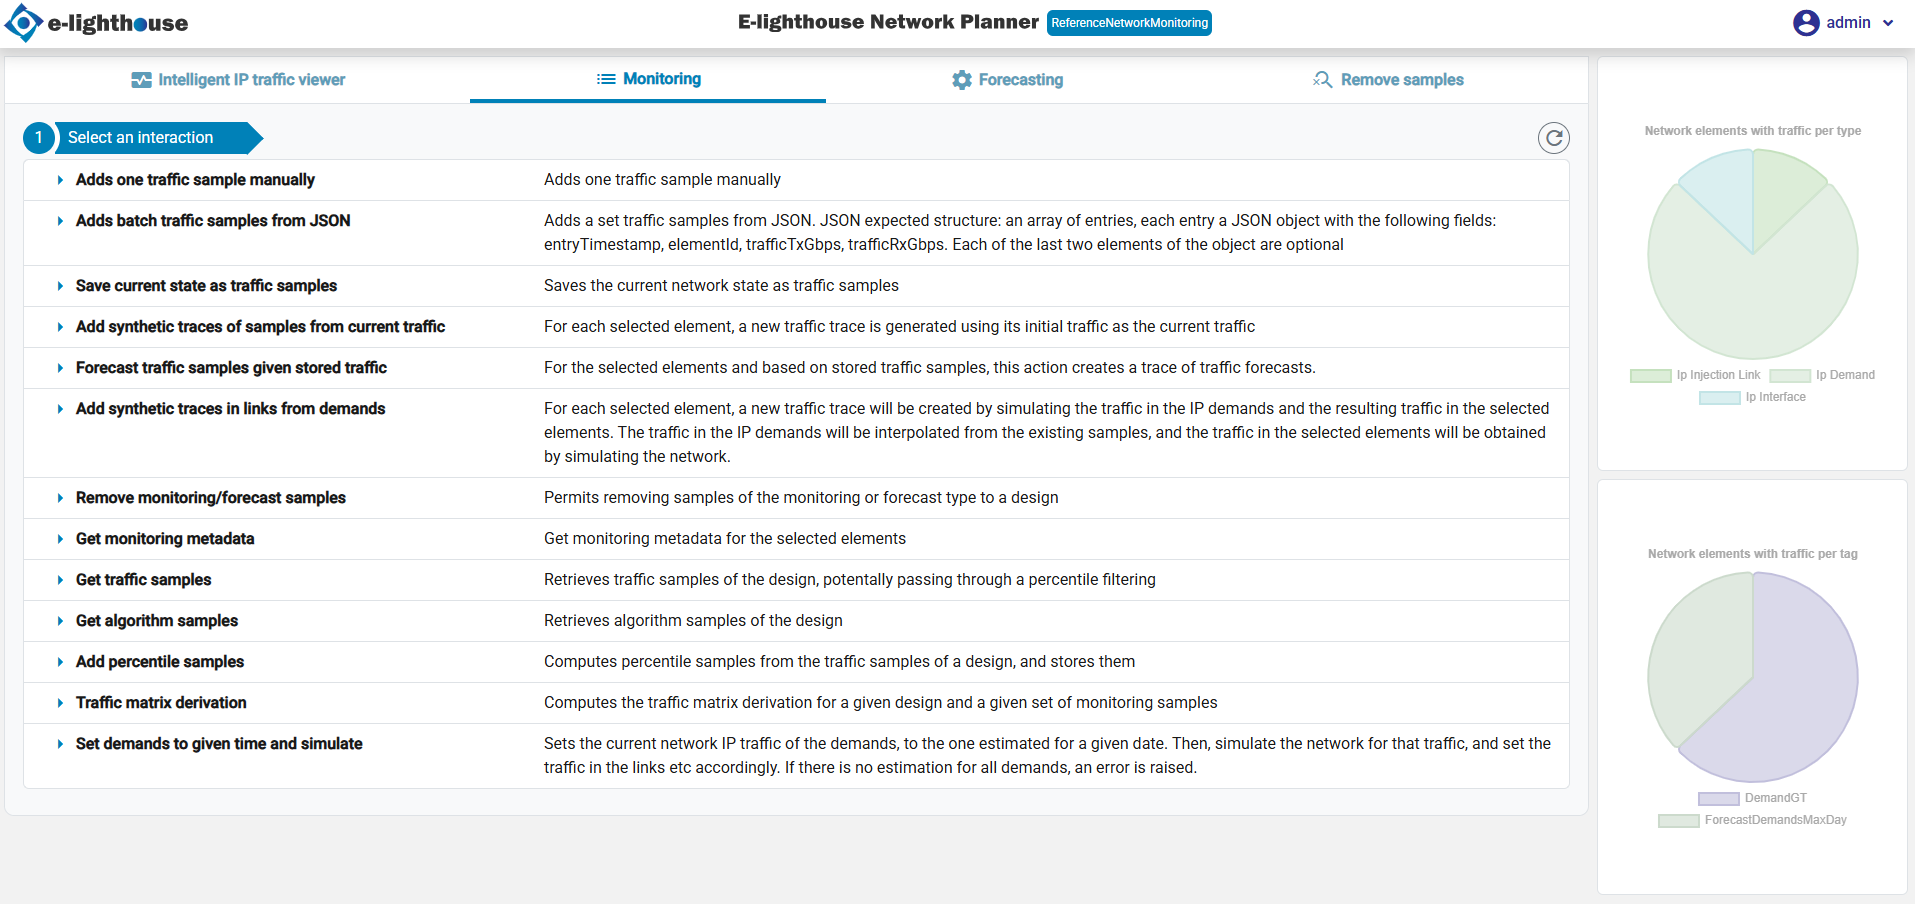
This tab focuses on advanced monitoring and forecasting tools. Users can analyze traffic patterns, identify trends, and gain insights into future network demands.
Forecasting
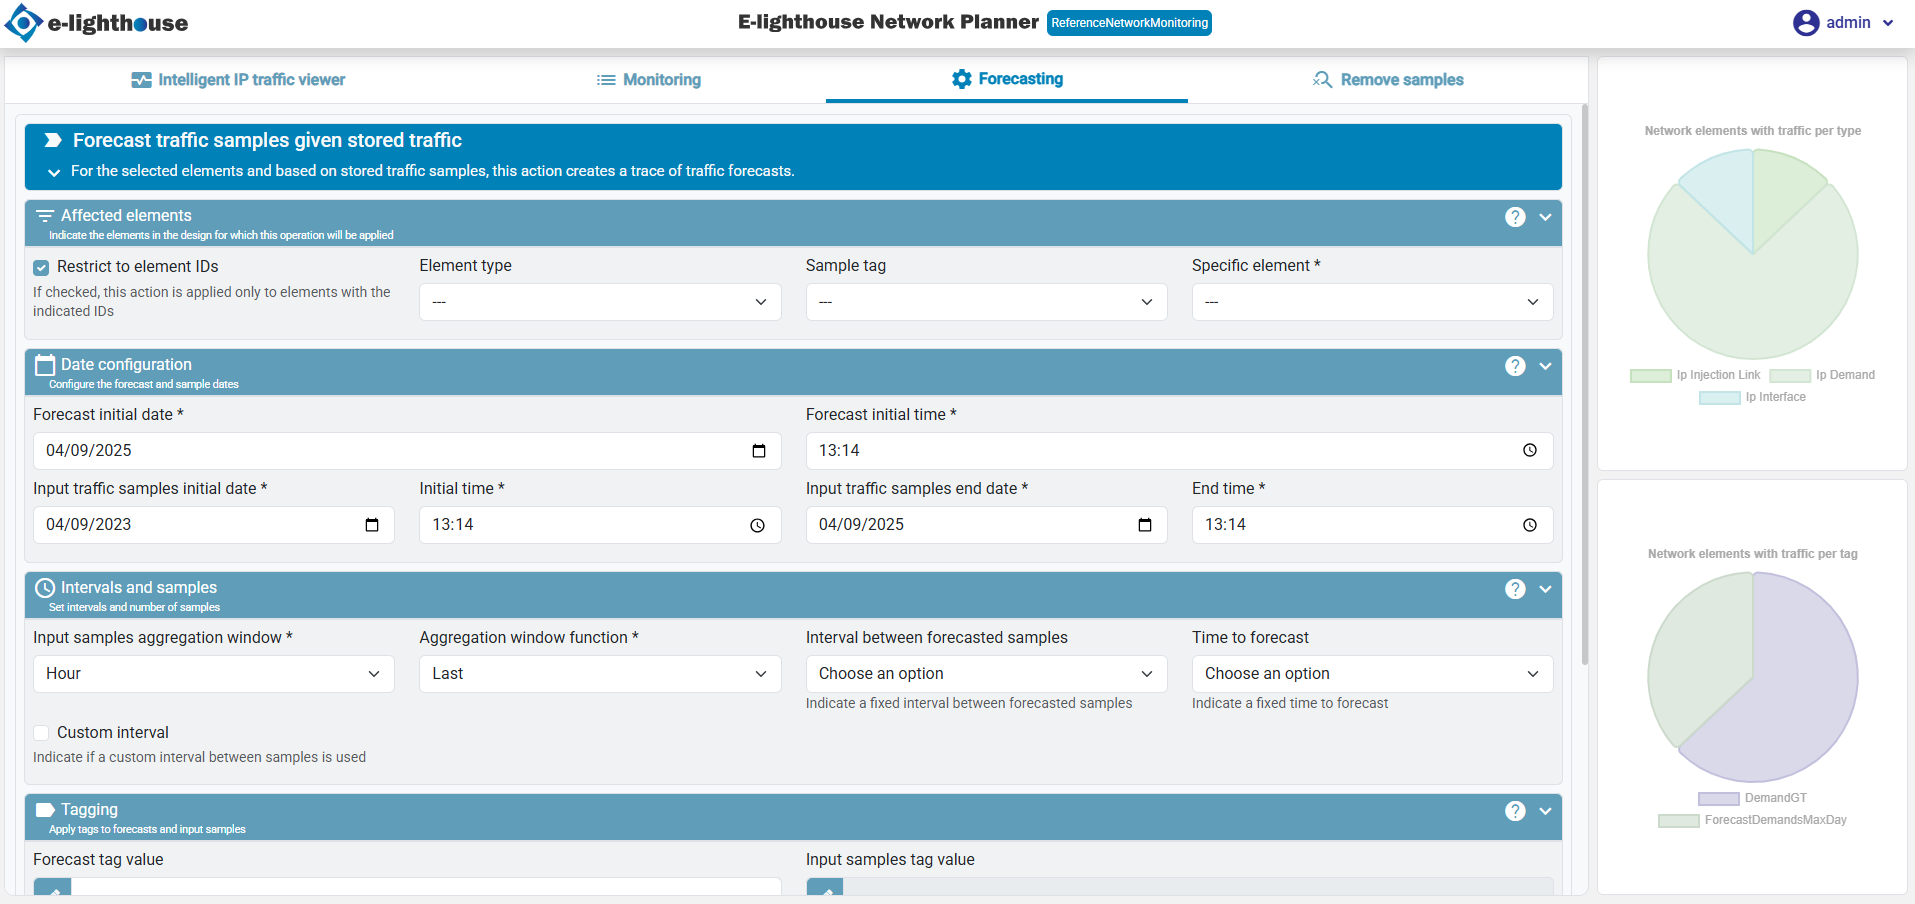
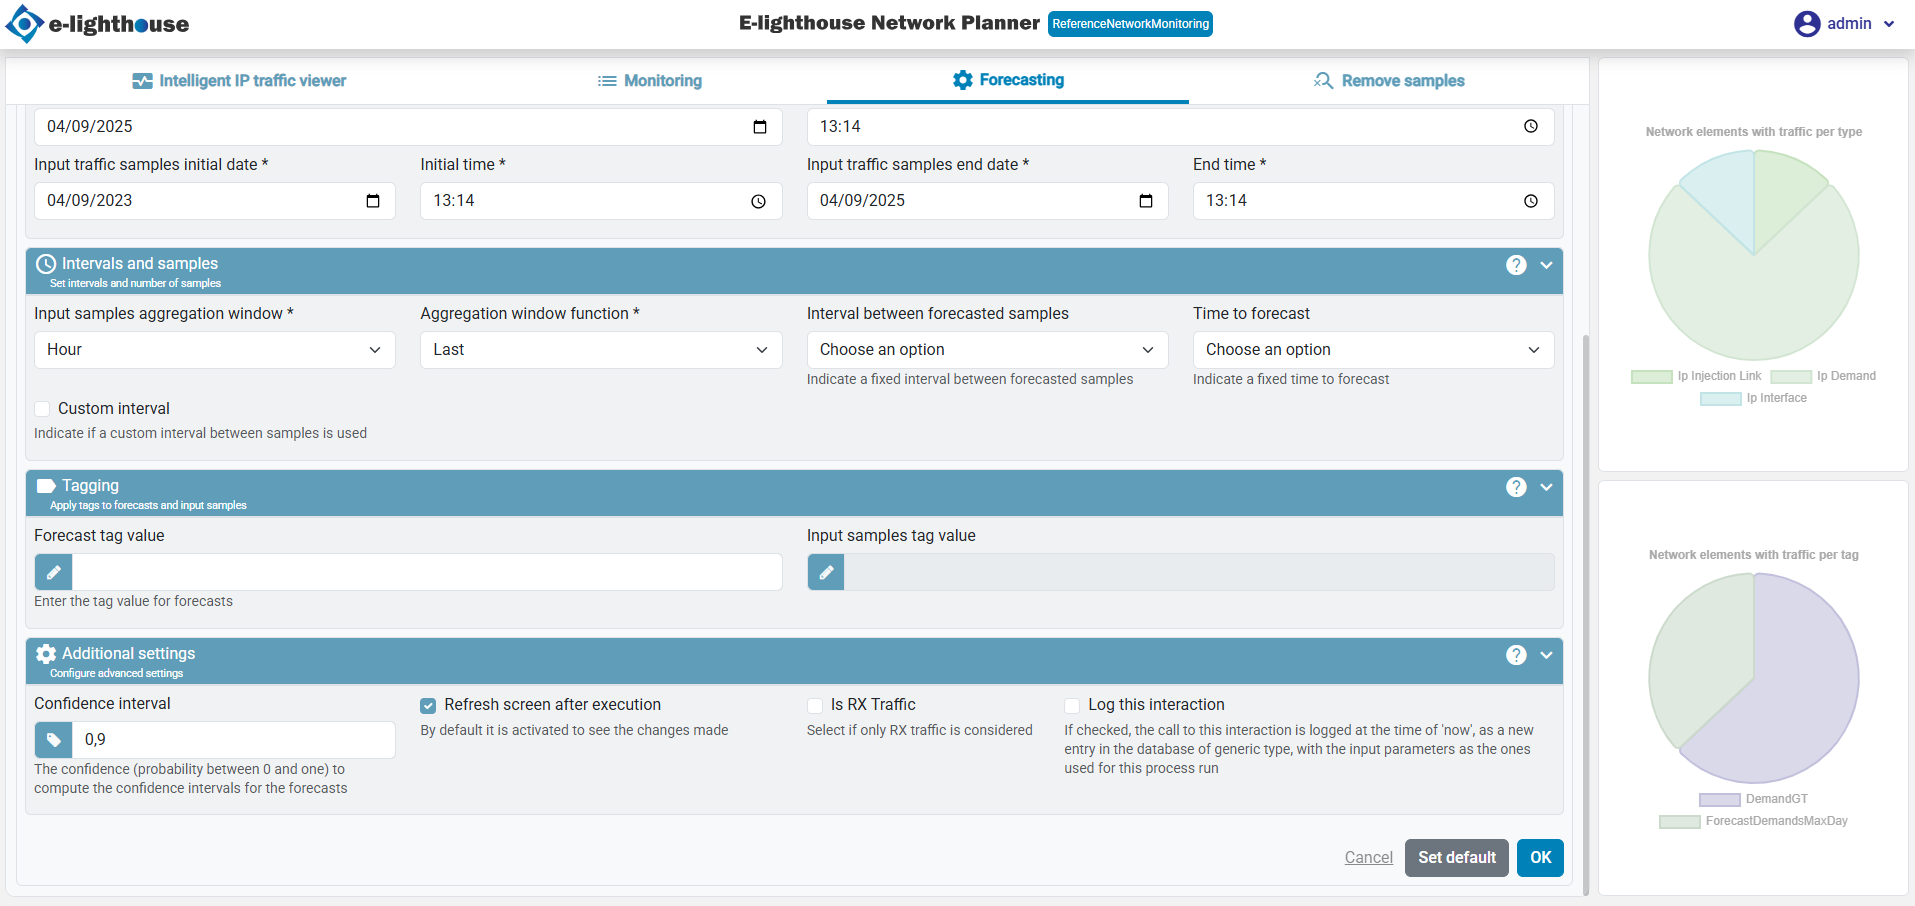
This tab is used to predict future traffic trends based on historical data.
Key Features
- A forecast configuration form to define prediction parameters.
- Automated generation of forecast graphs.
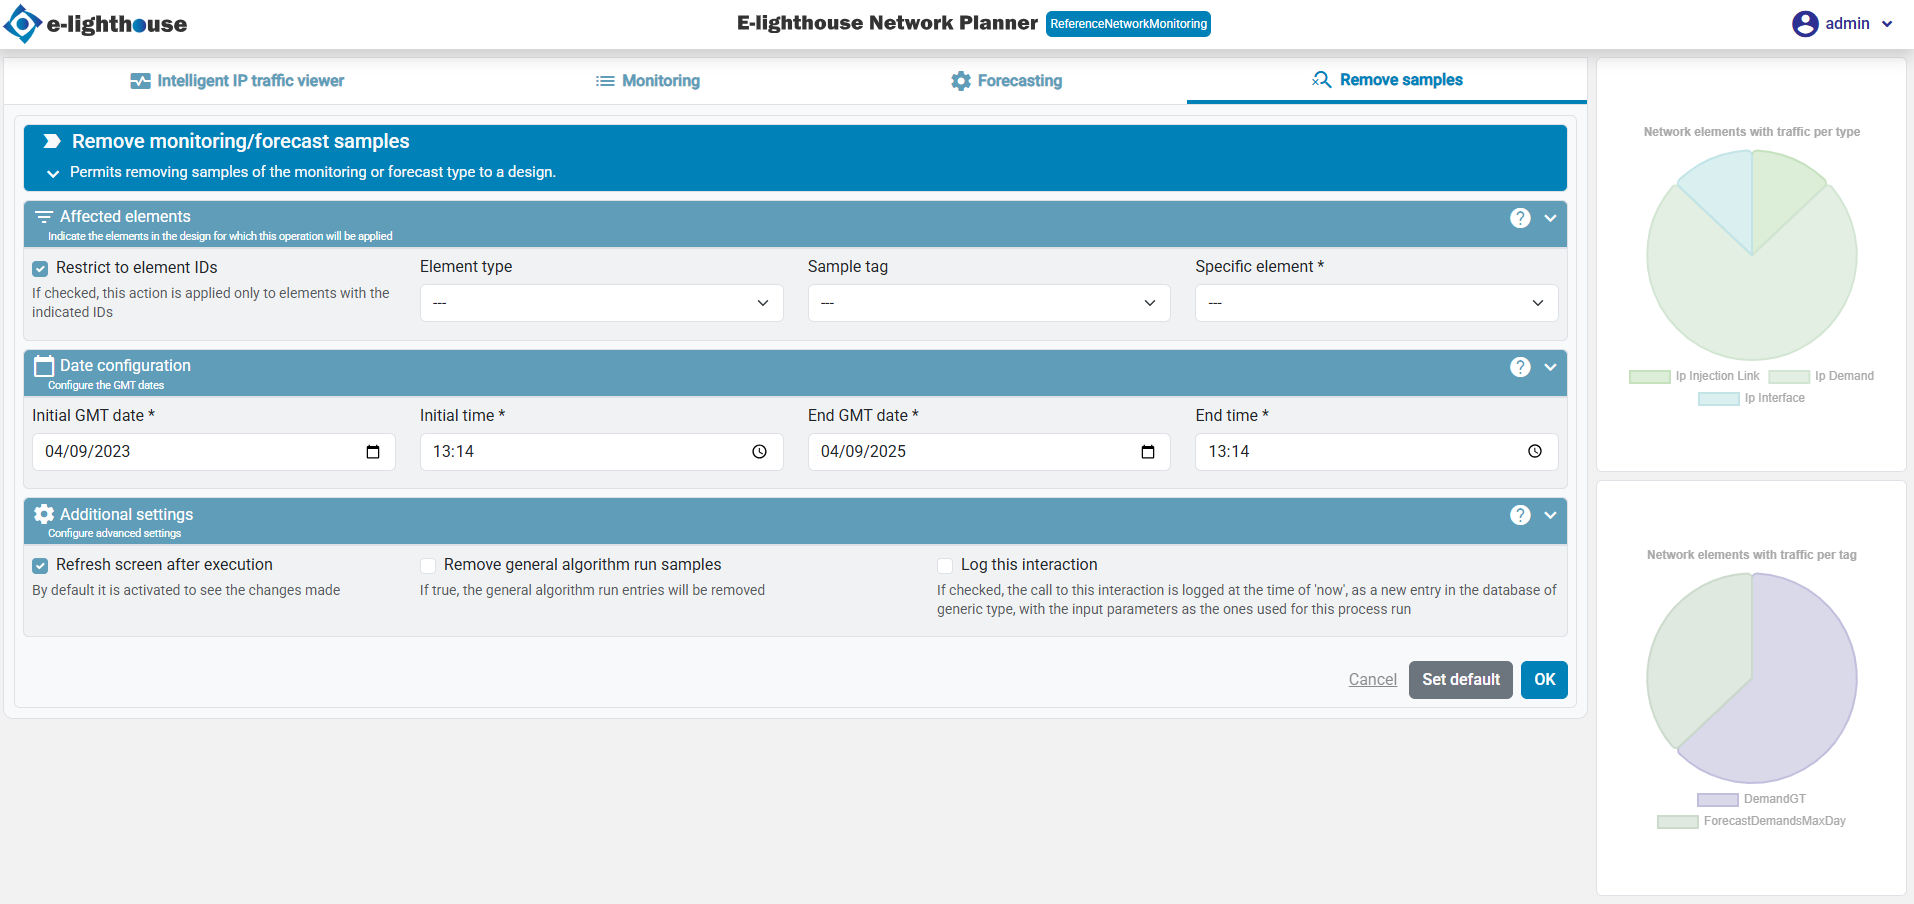
Remove Samples
This tab allows users to remove stored monitoring or forecast samples.
Key Features
- Selection of specific samples to be removed.
- Confirmation prompts to prevent accidental deletions.
Charts and Visualizations
The Monitoring & Forecast component includes two primary types of charts:
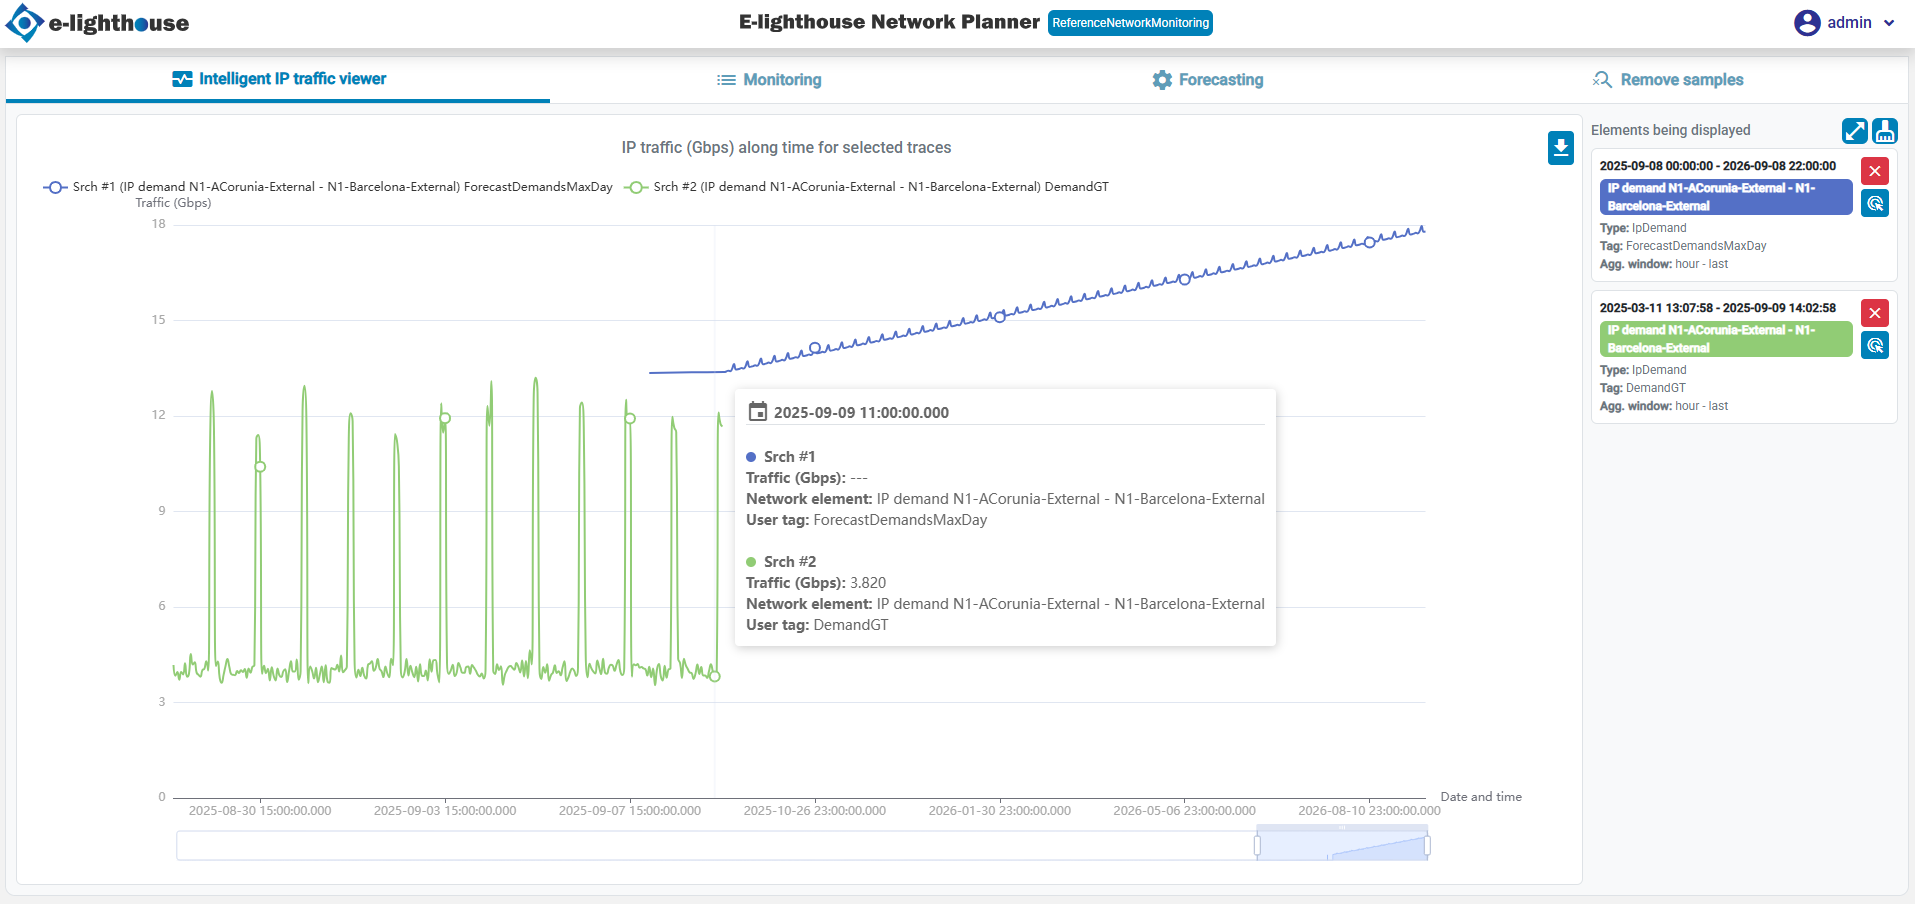
Main Chart
- Displays real-time and historical traffic data.
- Interactive elements allow users to explore detailed insights.
- Supports zooming, legend customization, and data export.
Summary Charts
- Provide an overview of traffic distribution by type and tag.
- Help users quickly identify trends and anomalies.
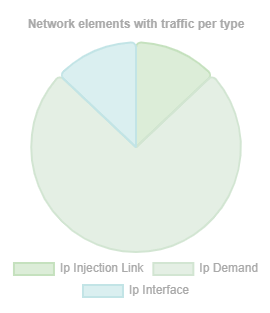
Network elements with traffic per type
This pie chart provides a breakdown of network traffic by the type of element. It helps users quickly understand which types of network elements are generating the most traffic.
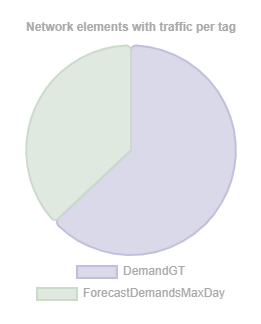
Network elements with traffic per tag
This chart categorizes traffic based on tags assigned to network elements. Tags can represent user-defined classifications or priorities.
Recommended Next Step
If you are still learning the product, read IP traffic monitoring and forecast after this page to understand the analytical context behind these screens.